Flexible Variable Star Extractor - software description
A distinct advantage of the CCD photometry is that CCD observations allow us to measure brightness of all stars from the field of the telescope simultaneously. Sometimes it happens that in the same field of view besides the main object we may see also other variable stars and sometimes we may discover an unknown variable star in the same field of view.
Over the years using CCD photometry different techniques for identifying variable stars were developed, including traditional "blinking" and "scatter" searches. One of the most popular algorithms is based on the dependency of noise level to mean brightness. The fainter an objects is, the smaller is the signal-to-noise ratio and the noisier is the measurement of the object. According to the statistics, if all stars were constant, the dependence of standard deviation of brightness vs. mean brightness of an object would have a parabola-like shape. If one star is variable, its standard error is greater than a constant object of the same mean brightness.
Particularly, this algorithm is implemented in the C-Munipack software package by David Motl, one of the most popular complete solutions for CCD images reduction. However, this solution does not work well when the data is noisy due to different reasons, so variable stars would appear in a heap of points at the diagram, and many constant stars with lack of data or outlying points will be located above the curve like they are variables. Particularly, the necessity of this work is due to the fact that we found no solution capable to analyze few experimental series of CCD images (field of view about 1 degree, more then 10000 detected stars).
We developed new software for variable stars detection that uses the data sets exported from C-Munipack. The program selects the comparison stars automatically unless user does not prefer to do it manually. Then it processes all time series using multiple comparison stars method (See "CCD Photometry Using Multiple Comparison Stars" by Kim Y., Andronov I.L., Jeon Y., in Journal of Astronomy and Space Sciences, 2004 - ADSABS link and "Algorithm of the artificial comparison star for the CCD photometry", Astronomical School's Report, 2004, ADSABS link) to get final light curves.
We implemented few simple filters and criteria that allow reducing the impact of outlying points, imaging artifacts and low quality CCD frames without careful manual time series reduction. At the final step FVSE calculates various variable detection indices:
- Raw Standard deviation
- Standard deviation
- sq.root( Chi-squared )
- MAD (Median absolute deviation)
- Robust median statistic
- Normalized excess variance
- von Neumann ratio
It allows plotting a two-channel diagram of selected pair of indices or mean brightness of the star to check any outlying point as variable candidate. One-click light curve and periodogram plot implemented. User can mark star as variable or false alarm to export data of all stars at the final stage. The program is in a beta stage, we are still working on some improvements in scientific and technical parts.
List of publications:
- Breus V. Flexible Variable Star Extractor - new software for variable stars detection using CCD photometry
Advances in Astronomy and Space Physics, 2017. Vol. 7, p. 3-5 (2017AASP....7....3B) - Breus V. Detection of new variable stars using CCD photometry: improved algorithm. 23rd Young Scientists' Conference on Astronomy and Space Physics,
proceedings of a conference held April 25-30, 2016 at Taras Shevchenko National University of Kyiv, pages 19-20.
Brief usage instructions
First you should process a set of CCD data using C-Munipack and export varfind data. If you don't know how to do it, first read the last block of this long paper. As the result you should get a set of 3 files with the same name and different extension: one FITS image with CCD chart, one XML file with all star coordinates and one text file with JD and instrumental mags of all detected stars (with extension .dat - it is important!!!).
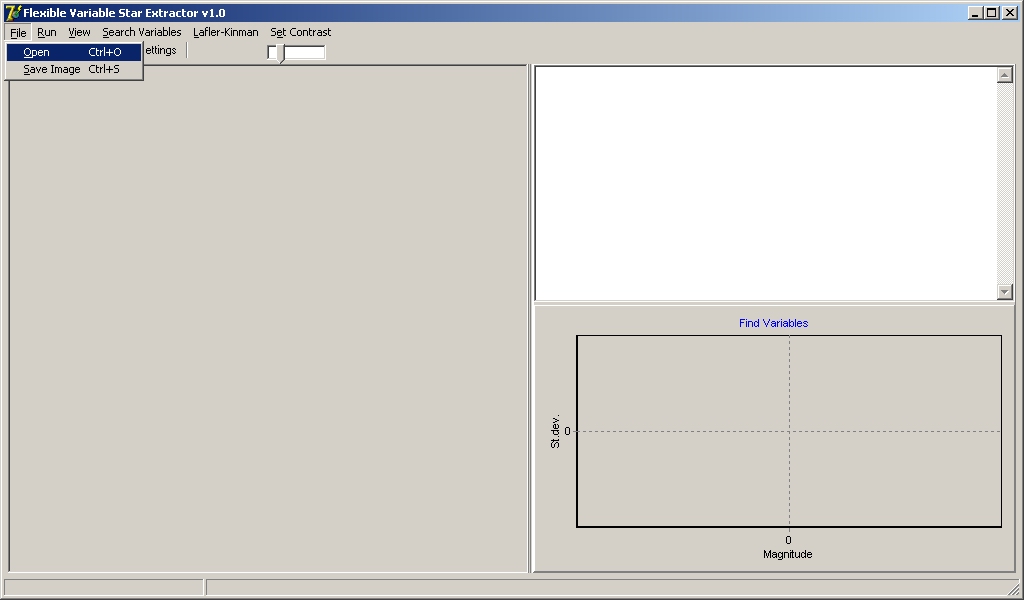
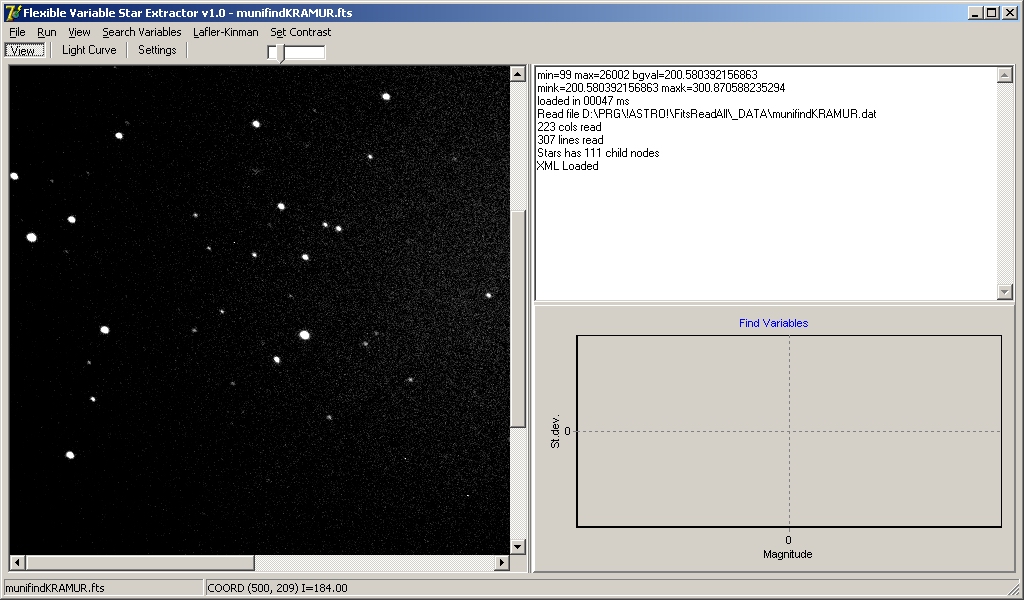
1. Launch FVSE, select File - Open menu or press trivial Ctrl+O. Some lines with information will appear in the text box on the right. If it looks not the same as at this screenshot and something will be wrong at the next step, probably, program did not find one of these 3 files. Maybe data file has .txt extension instead of required .dat (or I changed something in the next version xD ).

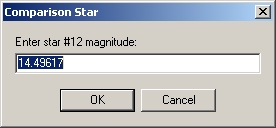
2. Choose one known comparison star. Right-click it on the chart and choose Select a Comparison menu item. The dialog will appear, you should enter the catalog value of the magnitude of this star. If you don't know it, you may just press enter but in this case you should not use exported light curves as the final data series in future step, because all magnitudes will be shifted.
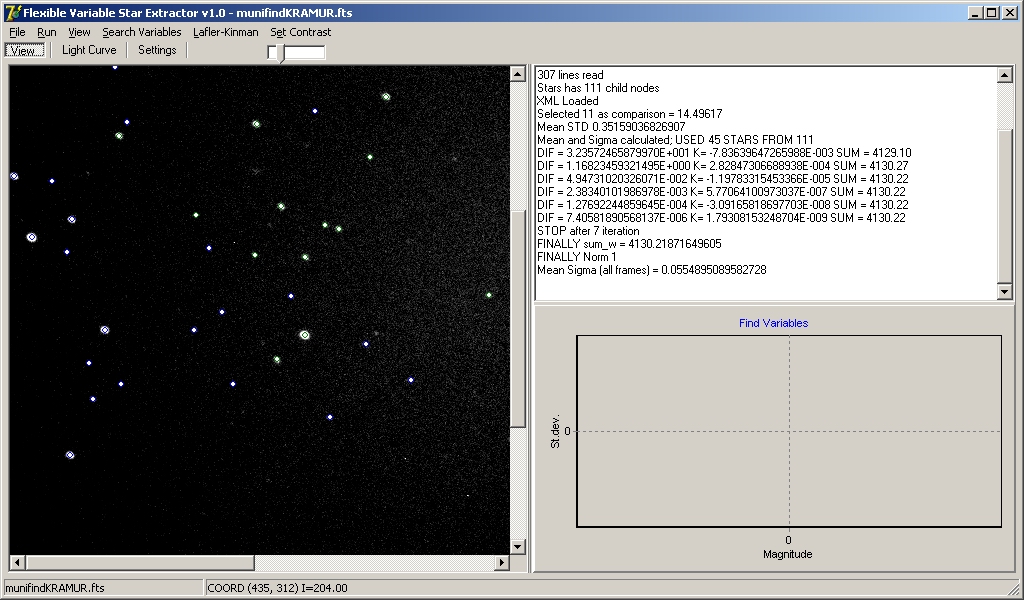

3. Now go to the main menu and choose Run item. FVSE will choose all comparison stars in the chart automatically and calculate the final stellar magnitudes of all stars using multiple comparison stars method. Next after it you should press Search Variables item of the main menu. Here the software will calculate the variable detection indices and plot the chart of standard deviation vs. the mean magnitude of all stars (by default). You may choose any other two-channel diagram in Settings tab and pressing Search Variables again to plot it.
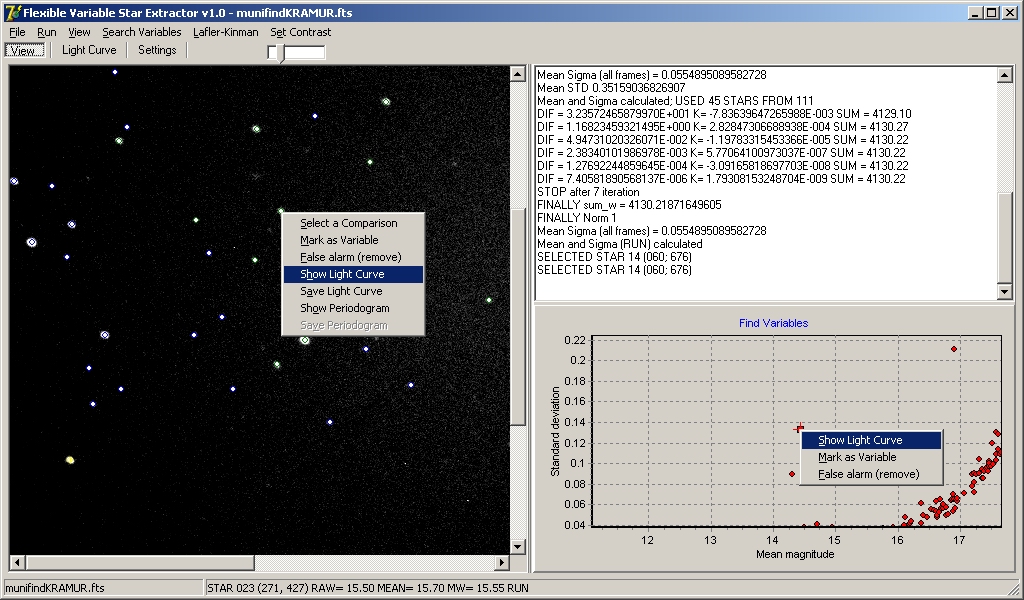
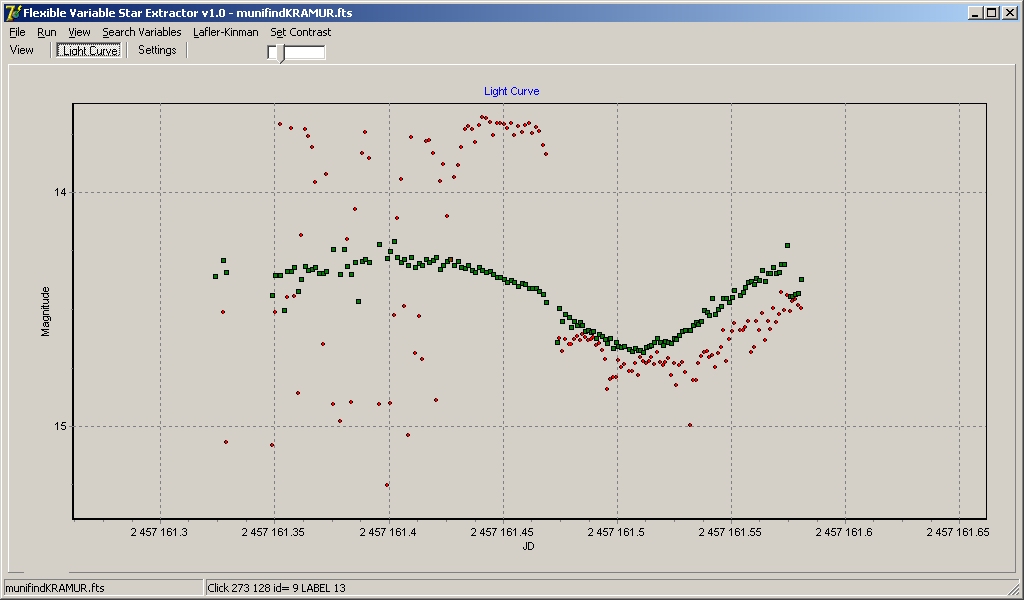
At any of these diagrams you may see most of points in the same cloud of points (probably, constant stars) and some outlying points that may correspond to variables. You should check these stars manually and mark them as variable or false alarm. To view the light curve of the star you should right-click the point at the diagram OR right-click the star at the chart and choose Show Light Curve in the corresponding pop-up menu, the Light curve tab will appear. It supports scaling (select region using left mouse button) or moving (drag it using right button). To reset the scale to full graph, press Ctrl+A hot hey or choose the same menu item. At the chart you may see two light curves. Green is for final magnitudes, red is for raw instrumental ones, thus red is noisy, green should not be noisy. Sometimes it's opposite for very bright stars. Red vertical lines shows the value plus and minus one sigma obtained from varfind data. Here you may delete some outlying points using right mouse button. Delete point means this point will not be used for any calculations until the program restart, Delete point for all does the same for the whole CCD (FITS) frame. After reducing the time series you may click Search Variables again and see the difference at the diagram. You may want to do Run again, it's useful if you removed enough "bad" points.
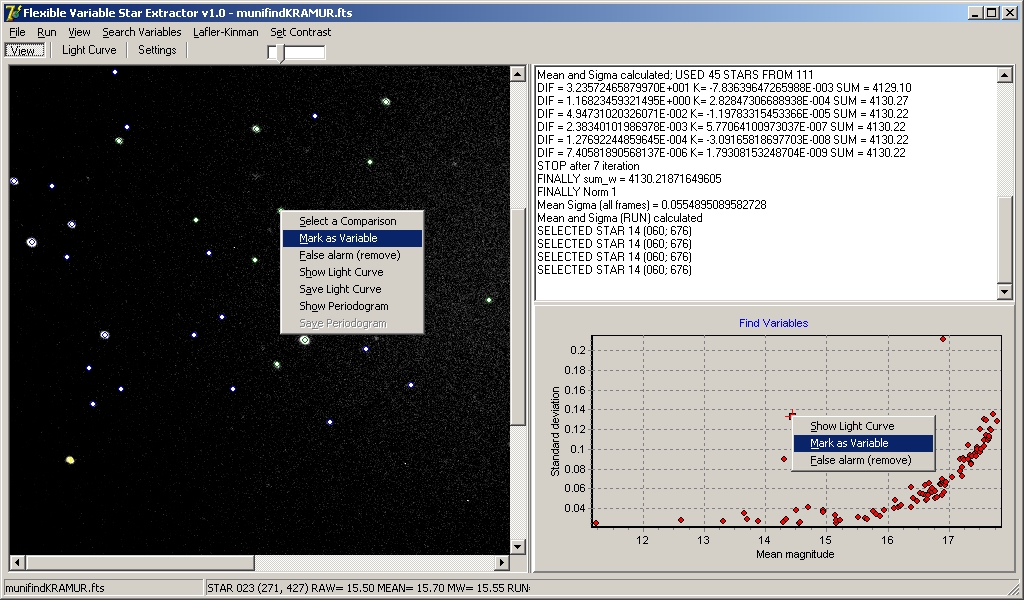
To mark the star as variable or false alarm, you may use corresponding items of the diagram menu. Variable star became green at the diagram (right) and red at the chart (left). False alarm points are removed from the diagram permanently.
Next you may want to export light curves of all previously marked variable stars. Do it using the pop-up menu. Also you may calculate and view a periodogram (Lafler-Kinman method is used, executed from the same menu). The state of marked points did not saved still, so you should not close the program before the work is finished. I suggest to use the computer hibernation mode to continue it later.

And few words about settings. The variability detection indices plotted as X and Y axes are selected using first block of settings. Critetia for comparison star selection are next. I suggest to exclude stars close to frame borders from the comparison star list to prevent possible situation when telescope tracking is not perfect and one comparison with relatively high weight will run out from the field of view, it may influence on the light curve. Use higher values in case of bad tracking. Next block limits the stars' measurements by its' mean sigma to calculate the variability indices. It works good to remove the outlying points.
There is some information in the status bar at the bottom. If you move the mouse above the chart you may see coordinates there. After "Run" there is also magnitudes, weights etc. Sometimes it's useful if you choose star at the diagram and want to know where is it located at the field of view to check if it's known variable, for example, in the Variable Star Plotter.
Used variability detection indices
Different indices work better for different types of variable stars, here we publish few screenshots with two-channel diagrams plotted for the same data set consists of 2 nights of observations with a 2-nights gap between. We marked as variable stars (green points) the next objects: MU Camelopardalis, an intermediate polar with an orbital period of 0.19 day; V442 Cam, an EW-type eclipsing binary with 0.44 day period; V440 Cam, EB-type system with a period of 1.15 days. The CCD quality is good so these sample data set represent the ideal case.
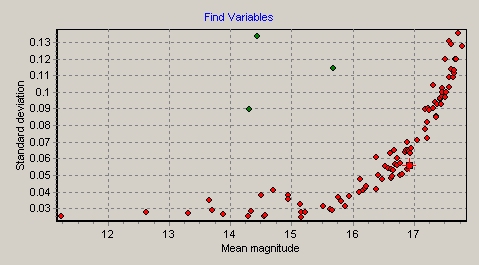 St. dev vs. mean magnitude |
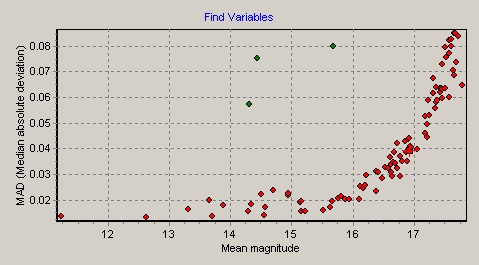 MAD vs. mean magnitude |
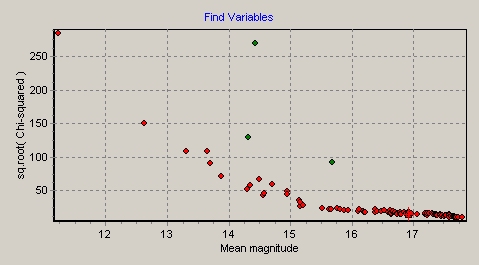 Chi-squared vs. mean magnitude |
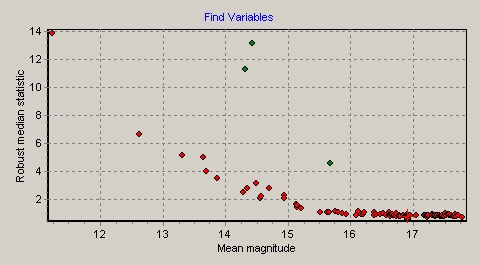 RoMS vs. mean magnitude |
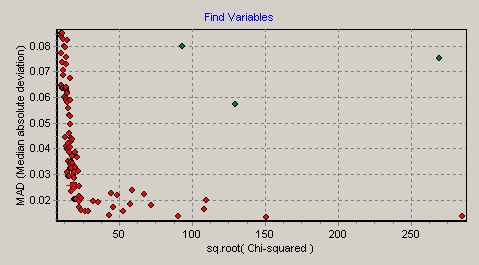 MAD vs. Chi-squared |
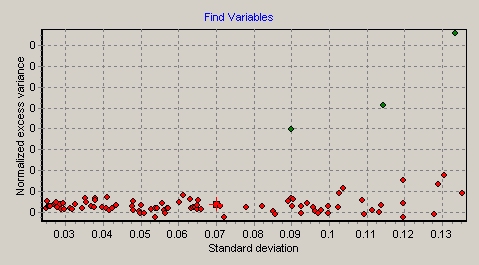 Normalized excess vs. St. dev. |
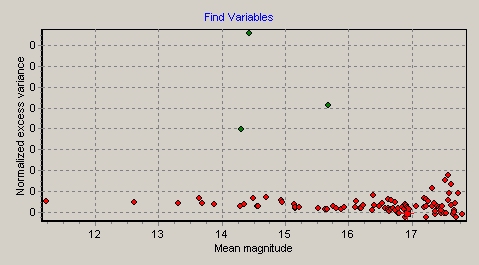 Normalized excess vs. mean magnitude |
How to obtain data?
This block is useful for observers who never used C-Munipack. First you should add all FITS frames to the project (version 2+) or just to the active window (v. 1.2.* that I like to use). Then do everything according to the program manual (dark, flatfield correction, photometry, matching).
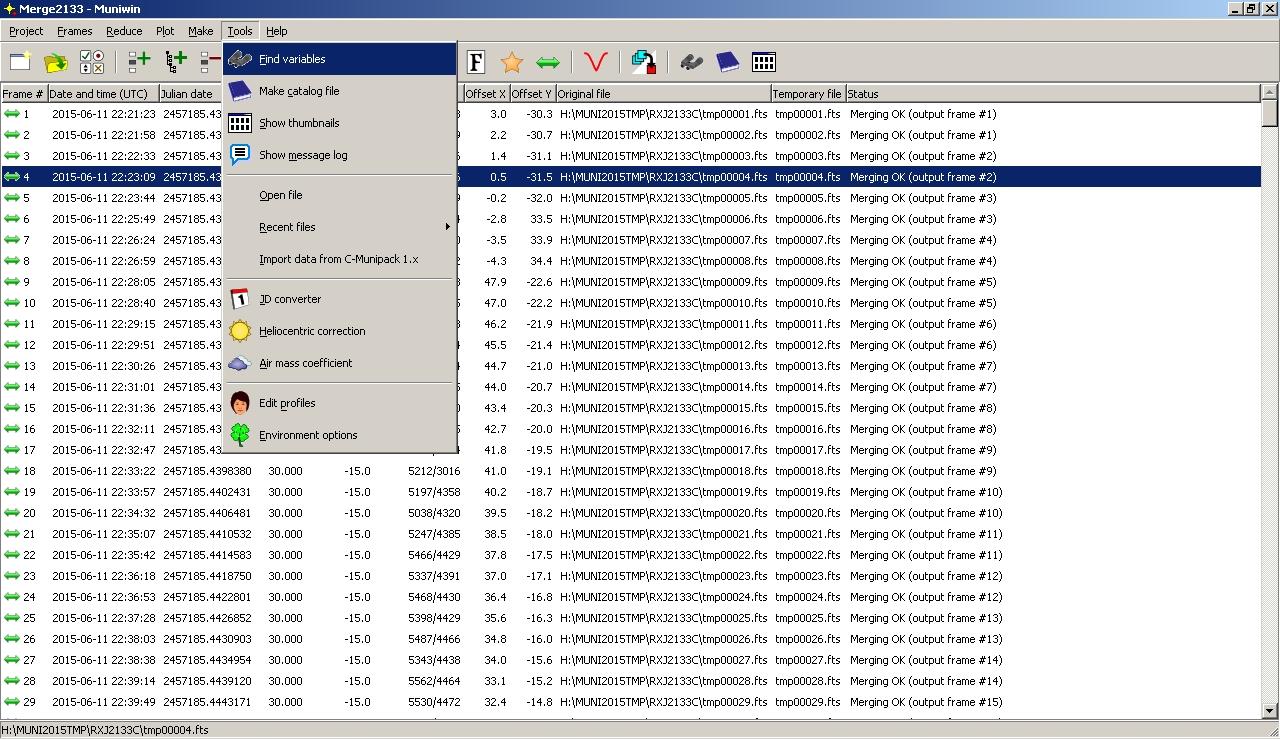
Then click Tools - Find variables menu. New window will appear with standard deviation vs. mean magnitude diagram at the left panel, chart at the right and light curve at the bottom. If the diagram has good parabola-like shape and only few outlying points, you may not need to use FVSE.
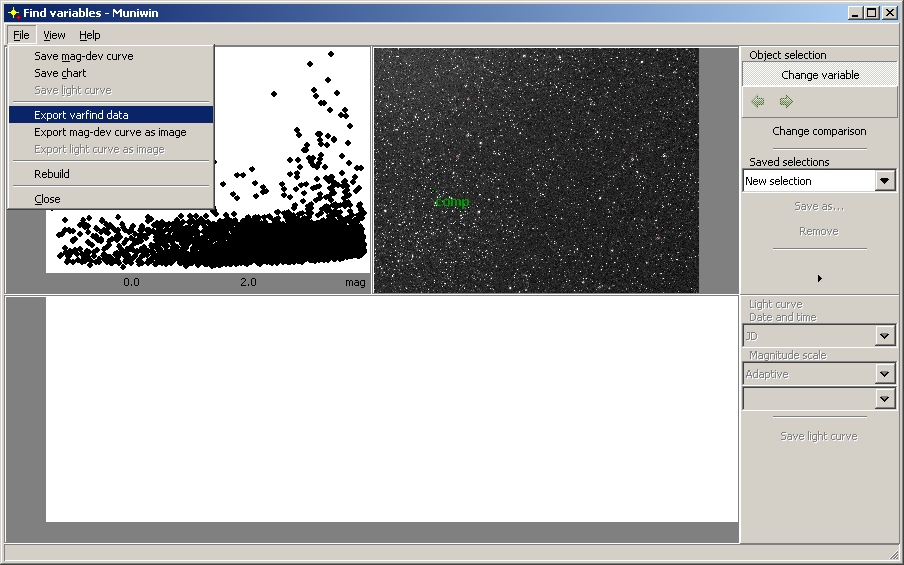

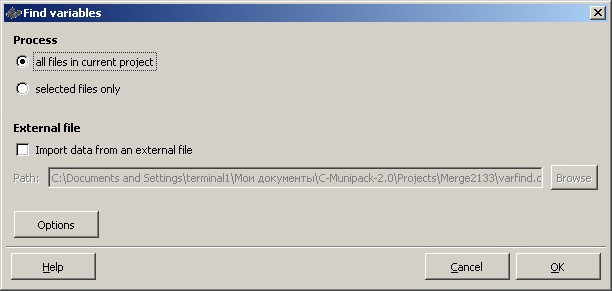
Click there File - Export varfind data menu item in latest C-Munipack versions (left) OR Export data button in the older ones (right). Then choose the file name with the extension .dat. It's important. C-Munipack will create three files (see earlier):
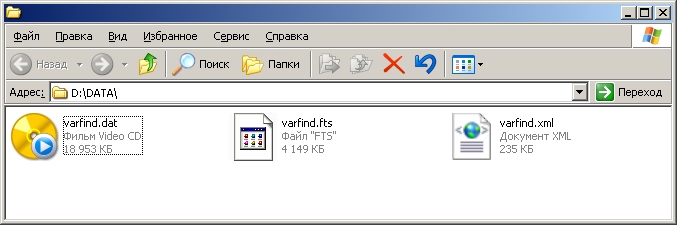
Now you may open FITS file from this set in the FVSE.